 ABSTRACTS/REPORTS: A09856 Bio-Medical Physics & Bio-Engineering, University of Aberdeen
|
ABSTRACTS/REPORTS: A09856 Bio-Medical Physics & Bio-Engineering, University of Aberdeen |
http://www.biomed.abdn.ac.uk/ |
Keith A. Goatman, Michael J. Cree, John A. Olson, John V. Forrester and Peter F. Sharp
For more details contact Keith Goatman ()
Microaneurysms (MAs) are one of the earliest visible lesions in diabetic retinopathy. The total number of MAs has been shown to be an indicator of likely future progression to more severe retinopathy. The MA population is known to be dynamic: new MAs are continually forming while existing ones disappear. As a result the overall number of MAs often remains relatively constant, not reflecting the extensive changes taking place in the retina.
To date only a limited number of studies have investigated this turnover in the MA population; there are considerable practical problems associated with the measurement, not least the time required to analyse even modest numbers of images manually. Computer assistance has been used in the past to aid the measurement [1,2], but these studies still required manual identification of every single MA. Furthermore the accuracy of manual measurements is limited by the unavoidable variation in observer performance.
We have described previously a fully automated computer system for detecting and quantifying MAs in fluorescein angiograms and red-free images, with performance similar to that of trained clinicians [3-5]. By aligning the follow-up image with the baseline image automatically MA turnover can be calculated without manual intervention. The system was shown to be fast, reliable and repeatable, making it suitable for processing large numbers of images.
Computer software was written to align the baseline and follow-up images [6], locate the fovea, and extract 512x512 pixel (approximately 18 degree) regions-of-interest centred on the fovea automatically [4]. The automated MA detector was then applied to both images. Finally the program analysed the locations of the MAs detected in the pair of images: MAs which were found in the same position in both images constituted a static MA; an MA present in the follow-up image but absent in the baseline image indicated a new MA; and an MA present in the baseline image but not the follow-up image represented a regressed MA.
Figure 1 shows example baseline and follow-up images for a single subject. Figure 2 shows the result of the turnover analysis.
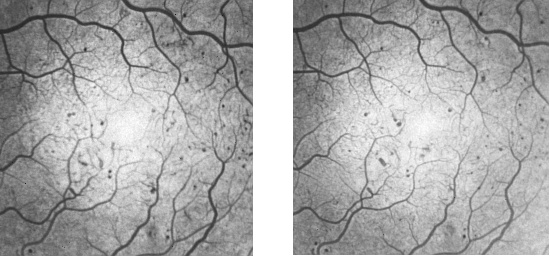
Figure 1: Example baseline (left) and follow-up (right) angiograms exhibiting multiple MAs. Note these images have been scaled from the original 512x512 images.
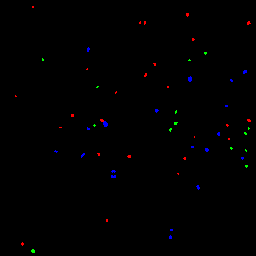
Figure 2: Result of turnover analysis applied to the baseline and follow-up images in figure 1 above. New MAs are shown in red, static in blue, and regressed in green.
In order to validate the performance of the automated system, software was also written to allow observers to mark manually MAs which they identified. The baseline and follow-up images were displayed side-by-side on the computer monitor. The images were viewed as negatives (i.e. the MAs appeared as dark lesions) and shade correction was applied to the images to maintain optimal contrast both inside and outside the foveal avascular zone (figure 3). The observers were able to note the positions of the majority of the MAs with a single mouse click - a region-growing algorithm then delineated the full extent of the lesion. The MAs were shown overlaid in green following selection. Occasionally the region-growing algorithm failed for lower contrast lesions. In such cases the operator was able to manually "paint" the lesion using the mouse.
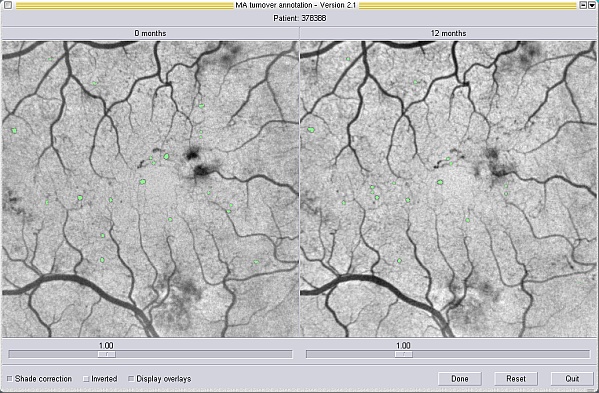
Figure 3: Screen-shot from the software used to mark MA locations manually. The baseline and follow-up images are shown side-by-side and are shade corrected to maintain contrast inside and outside the foveal avascular zone. MAs which have been marked are labelled in green.
Two clinical datasets were used to evaluate the performance of the automated turnover measurement system. The first consisted of 10 patients who had two fluorescein angiograms (FAs) acquired a year apart. These data were analysed, both manually and using the automated system, to investigate the inter-and intra-observer variation associated with manual measurement, and to assess the performance of the automated system. The second dataset contained FAs from a further 25 patients. This dataset was analysed using only the automated system to investigate some properties of microaneurysm turnover, in particular the differing detection sensitivities of new, static and regressed microaneurysms.
Diabetic retinopathy is a condition which progresses relatively slowly. It was necessary for trials such as DCCT and UKPDS to recruit large numbers of patients and follow them for many years to enable trial endpoints to be reached; typical endpoints being new vessel formation or macular thickening. However, diabetic retinopathy is predominantly a disease of capillary occlusion. MA turnover is likely to produce more sensitive measures of these changes than relying on later complications. In contrast to measures of absolute counts, which have been shown here to hide the continual process of capillary occlusion and remodelling, turnover measures provide information about the dynamic nature of the disease at the capillary level.
The automated is fast and was found to be reliable, making it suitable for processing studies containing large numbers of images. The system also works with red-free images. Whilst fewer MAs are visible on red-free images, the non-invasive nature of the procedure is attractive and current work is investigating whether red-free turnover correlates with the turnover seen on angiograms. The automated system may have value in a screening context, in treatment evaluation, or for research on the dynamic nature and behaviour of the MA population.
|
ABSTRACTS/REPORTS: A09856 |
2nd October 2003 | http://www.biomed.abdn.ac.uk/ |