 ABSTRACTS/REPORTS: A07890 Bio-Medical Physics & Bio-Engineering, University of Aberdeen
|
ABSTRACTS/REPORTS: A07890 Bio-Medical Physics & Bio-Engineering, University of Aberdeen |
http://www.biomed.abdn.ac.uk/ |
Keith Goatman
Diabetic retinopathy is the most common cause of blindness in the working-age population in the UK; around 1000 people annually are registered blind due to diabetic retinopathy.
Vision loss may result in a number of ways, including retinal detachment, oedema, and the proliferation of new vessels. Providing that an early diagnosis is made, laser therapy may be used to save vision --- early treatment has been shown to be highly effective in reducing the incidence of sight loss. It has been estimated that laser treatment prevents blindness in 90% of cases treated before proliferation of new vessels begins.
Currently 2.5% of the UK population are diabetic, and this appears to be increasing. Around 30% of diabetics have some form of retinopathy, and one third of these require treatment to prevent imminent blindness.
Microaneurysms (MAs) are one of the earliest lesions visible in diabetic retinopathy. Since they are almost never associated with any symptoms, and are not themselves a threat to sight, they act as a warning of possible future problems. MAs form in small blood vessels due to a weakening of the vessel wall. Since the wall of the MA is weak it is prone to leaking, which leads to the more serious complications of retinopathy. MAs are therefore an important lesion in any retinopathy screening programme. The UK National Screening Committee has set up a Diabetic Retinopathy Screening Group to develop guidelines for a cost-effective national screening programme.
Screening the entire diabetic population annually represents an enormous increase in workload for specialist ophthalmologists. Computer automated detection of MAs offers a fast, objective and reproducible method for quantifying MAs, which could reduce the manual workload. Methods have been developed in Aberdeen to analyse MAs in both fluorescein angiograms and red-free images which are described in detail in this report.
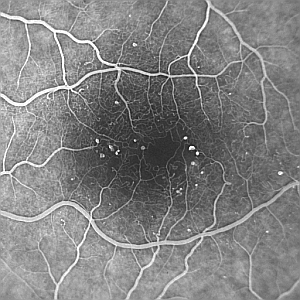
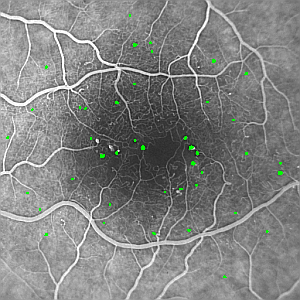
Microaneurysms appear as small, roughly circular lesions on the retinal photographs, as shown in figure 1. Detection of MAs may be seen as a classical image processing problem involving three stages: pre-processing, segmentation, and classification [1-5].
A |
B |
| Figure 1: Example fluorescein angiogram showing multiple microaneurysms (small white dots), which have been labelled automatically in green in (B). Note the darker region in the centre of the image which corresponds to the foveal avascular zone (FAZ). The image was acquired using a Topcon fundus camera with a Kodak MegaPixel CCD camera attached [NB:the images have been reduced in size for this document]. | |
Pre-processing is used to correct image problems (for instance the removal of noise and other uninteresting features, or the correction of illumination artefacts) and to enhance the desired image feature, in this case MAs [5]. There were three stages to the pre-processing: shade-correction, vessel suppression using morphological operators and match filtering.
Shade correction removes large scale image background variations [1,5]. These may be due to illumination variations across the field of view or physiological differences, such as the foveal avascular zone. Figure 2 shows the effect of shade correction on the FA image in figure 1. Shade correction exploits the property that illumination variations change at a much lower rate than features do --- illumination variation involves only low spatial frequencies. An estimate of the background may be found by removing all but the low spatial frequencies from the image. This may be achieved using a low pass filter. The background estimate may then be subtracted from the original image to correct for background variation.
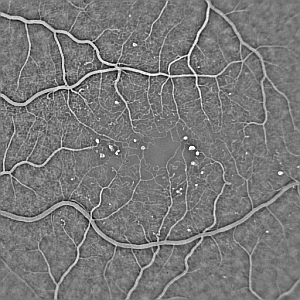
Figure 2: Effect of shade correction on the fluorescein image from figure 1. |
Vessels and structures such as haemorrhages may be removed by excluding all structures which are larger than a given linear distance in any direction. This is achieved using greylevel morphological filtering [1,2]. The well known Top Hat Transform enhances bright objects which cannot be fully contained within the structuring element. The Top Hat Transform is calculated by subtracting the result of morphologically opening the image from the original image. Note that for red-free images, where the MAs appear as dark circular regions, the image may either be inverted prior to applying the Top Hat Transform, or the complement of the Top Hat Transform (often known as the Bottom Hat Transform may be used).
The shape of the structuring element must be chosen carefully. A naive choice would be a circular structuring element, with a diamter slightly larger than the largest expected MA. Figure 3A shows the result of such a structuring element. The MAs are visible in the image, but so are the blood vessels.
A better solution uses a linear structuring element (i.e. a rectangle with a width of only one pixel). Figure 3B shows the result of a horizontal structuring element, which detects MAs whilst suppressing horizontal blood vessels. Figure 3C shows the result of a vertical structuring element, which detects MAs whilst suppressing vertical blood vessels. Finally figure 3D shows the effect of combining 8 linear elements at equally spaced angles, detecting MAs whilst suppressing almost all the blood vessels.
A |
B |
C |
D |
| Figure 3: Result of the Top Hat Transform on the image in figure 1 using (A) a circular structuring element (diameter 5 pixels), (B) a horizontal linear element, (C) a vertical linear element, (D) the result of combining linear elements at 8 equally spaced angles. Note the linear elements in (B)-(D) were all 11 pixels in length. | |
A matched filter (sometimes known as a matched detector) is designed to detect a known signal from a noisy background [2]. Matched filtering is used to enhance features which resemble a MA, i.e. small, bright circular regions. An 11 by 11 pixel Gaussian function (standard deviation equal to 2) was used as a model MA. The result of the matched filtering is shown in figure 4. The intensity of the resulting regions approximate the probability of the region being a true MA.
Figure 4: Result of matched filtering. |
The intensity of the regions in the matched filter result is related to the likelihood of the region being a true MA. A threshold is applied to the image to remove the least likely MA candidates. The threshold is set to be low, since an MA erroneously discarded at this point cannot be counted later on. Following thresholding of the image in figure 4 there are 721 candidate MAs, shown in figure 5A.
To reduce the number of false candidate MAs, and to ensure each candidate is fully delineated, a region growing algorithm was applied to each candidate [1]. Regions were grown beginning at the centre of each candidate. Growth is dependent on the intensities surrounding the current pixel in the original shade-corrected image. Regions which grow to exceed a size greater than the largest expected MA (probably because they represent a vessel or large haemorrhage) are excluded from further analysis. In the example shown here, following region growing there are 380 candidate MAs remaining, shown in figure 5B.
A |
B |
| Figure 5: Result of segmentation. (A) Following thresholding (721 candidate MAs) and (B) following region growing (380 candidate MAs). | |
Various features of the remaining MA candidates are used to classify the regions, including morphological parameters such as perimeter length, aspect ratio, complexity (ratio of the square of the perimeter to the area), and intensity parameters such as energy (the sum of the region intensities) as well as parameters based on the matched filter response. These parameters are all fed into a linear rule-based classifier.
Following classification, 42 out of the original 721 candidates following thresholding are eventually classified as possible MAs. They are shown overlaid on the original image in figure 1.
The automated MA detector has been used in a number of projects using both fluorescein and red-free images. It may be used to detect the presence of MAs, count MAs or quantify the change in the number of MAs over time. The software was also used in a large study funded by the NHS Technology Assessment Programme.
3783 red-free (50 degree field of view) images from patients with diabetic retinopathy were analysed by the automated system and the result compared with the opinion of a clinical research fellow examining the same images. The program achieved a sensitivity of 81% and a specificity of 93% for the detection of images containing MAs.
In an experiment intended to mimic a screening scenario, 925 patients, each of whom had two fields of both eyes imaged, were analysed by the automated system. The same images were graded by a clinician and the overall patient retinopathy grade determined. The program achieved a sensitivity of 85% and a specificity of 76% for the detection of patients with any retinopathy (positive predictive value 0.71, negative predictive value 0.88).
A group of 586 patients recruited from the diabetic clinic underwent three or four mydriatic retinal examinations. The performance of digital retinal imaging, colour fundus photography and slit-lamp biomicroscopy performed by optometrists were assessed for their possible contributions to a retinal screening programme. All three methods were compared with specialist ophthalmologists using a slit-lamp. Automatic grading of the digital images was also evaluated.
Slit-lamp examination by optometrists achieved a sensitivity of 73% and a specificity of 90% for the detection of referable retinopathy. Manual grading of the two field digital images achieved a sensitivity of 93% and a specificity of 87%. Using colour slides the sensitivity was 96% and the specificity 89%. Almost identical results were achieved using only the macular field. Digital imaging had a lower failure rate (4.4% of patients) than colour photography (11.9% of patients). Applying the automated detector to the images resulted in a sensitivity of 83% and a specificity of 71% for the detection of any retinopathy, and a sensitivity of 76% and specificity of 85% for the detection of macular oedema.
An automated system has been successfully developed which is able to detect MAs in fluorescein and red-free fundus images with a performance approaching that of trained clinical observers. Furthermore, it has been shown that the system can perform a useful role in the context of a diabetic screening programme, quickly eliminating 50% or more of the screening population who have no retinopathy, focusing the manual effort. Quantitative analysis may be used to observe patients over time and to evaluate treatments in an objective manner.
|
ABSTRACTS/REPORTS: A07890 |
10th July 1997 | http://www.biomed.abdn.ac.uk/ |