 ABSTRACTS/REPORTS: A01128 Bio-Medical Physics & Bio-Engineering, University of Aberdeen
|
ABSTRACTS/REPORTS: A01128 Bio-Medical Physics & Bio-Engineering, University of Aberdeen |
http://www.biomed.abdn.ac.uk/ |
Keith A. Goatman, A. David Whitwam, A. Manivannan, John A. Olson, Peter F. Sharp.
For more details contact Keith Goatman ()
The development of a nationwide eye screening programme for the detection of diabetic retinopathy has generated much interest in automated screening tools. Currently most such systems analyse only intensity information — discarding colour information if it is present. Including colour information in the classification process is not trivial; large natural variations in retinal pigmentation result in colour differences between individuals which tend to mask the more subtle variation between the important lesion types. This study investigated the effectiveness of three colour normalisation algorithms for reducing the background colour variation between subjects. The normalisation methods were tested using a set of colour retinal fundus camera images containing four different lesions which are important in the screening context. Regions of interest were drawn on each image to indicate the different lesion types. The distribution of chromaticity values for each lesion type from each image was plotted, both without normalisation and following application of each of the three normalisation techniques. Histogram specification of the separate colour channels was found to be the most effective normalisation method, increasing the separation between lesion type clusters in chromaticity space and making possible robust use of colour information in the classification process.
This work appeared in similar form in Goatman K.A. et al. Colour normalisation of retinal images. In: Proceedings of Medical Image Understanding and Analysis 2003.
Diabetic retinopathy is currently the major cause of blindness in the UK working-age population. The fact that blindness can usually be delayed and often prevented, providing the disease is caught sufficiently early, has recently prompted the establishment of a nationwide screening programme. Since approximately 2% of the population are diabetic, and annual screening has been recommended, the screening programme will generate a very large number of images for analysis. It is therefore not surprising that interest in automated screening techniques [1] has increased rapidly in the last few years. However, despite high resolution colour cameras being the accepted standard for screening programmes, automated software tends currently to base its analysis on intensity information alone, either from `red-free images' or using the green channel of RGB colour images. More than a decade ago Goldbaum et al. [2] showed significant differences in the colour measurements of lesions in retinal images. Since then little interest has been shown in colour classification of retinal images. In practice, while models exist to identify abnormal coloured objects within the retinal image [3,4], without some form of colour normalisation or adaptation for the background pigmentation the large variation in natural retinal pigmentation across the population confounds discrimination of the relatively small variations between the different lesion types.
The human visual system is a poor spectral analyser; our perception of colour is based on the responses of only three receptor types sensitive to three bands of wavelengths. The consequence of this is that widely differing spectra produce the exactly the same colour perception. Colour cameras also use only three receptors, since this is all that is required to match human perception of colour. Given the remitted spectrum it is possible to calculate the red, green and blue colour channels values. However the inverse problem is hugely under-determined, hence changes which may be deduced using a multi-channel spectrum analyser will not necessarily be detectable using only three colour sensors. A feature of human vision is that it adapts automatically and subconsciously to relatively large changes in the illuminating spectrum so that white objects are still perceived as being white. A similar effect is seen, for instance, if an image is projected onto a screen which is cream coloured; white objects in the projected image are still perceived as being white. This process is known as \emph{colour constancy}. In contrast to human vision, colour cameras do not adapt automatically to changes in illumination. The lesion colour measured by the camera depends on:
Note that all the lesions, except drusen, are positioned in front of all the pigmented retinal tissue (i.e. in front of the RPE, choroid and photoreceptors). All the lesions are of a similar colour and occupy a relatively small area of the complete colour space.
Three colour normalisation algorithms originally intended for making colour images invariant with respect to the colour of the illumination were investigated for their ability to make the retinal images invariant with respect to background pigmentation variation between individuals.
Colour normalisation does not aim to find the true object colour, but to transform the colour so as to be invariant with respect to changes in the illumination — without losing the ability to differentiate between the objects of interest.
The three methods tested were (the effect of each is shown in figure 1):
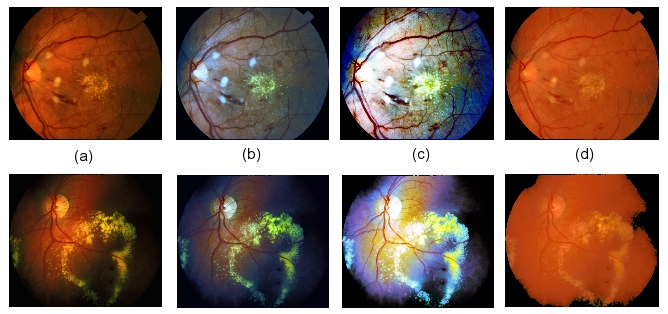
Figure 1: The effect of colour normalisation on two sample retinal images: (a) Original images (no normalisation), (b) Greyworld normalisation, (c) Histogram equalisation, (d) Histogram specification.
In order to compare the normalisation methods a dataset of 18 colour retinal fundus camera images was compiled, where each image was known to contain at least one of the following lesion types which are important for retinopathy screening:
The images were acquired using a Topcon fundus camera and recorded on 35mm colour slide film. The images were digitised (approx. 1000\,dpi) using a Nikon Coolscan 4000ED slide scanner, producing RGB colour images with 8 bits per colour channel. The retinal images are circular; masks were generated automatically by simple thresholding of the green colour channel followed by 5x5 median filtering to exclude the dark background from the colour normalisation calculations. Regions of interest were drawn around the different lesions for all the images and masks produced with a specific greylevel value representing each lesion type. Five of the images contained CWS, fourteen contained HE, and six contained BH. Only two of the images contained drusen. The same region of interest masks were used to analyse the images before and after normalisation.
Colour may be represented independently of its intensity by dividing the red, green and blue channel values by the sum of the three channels, i.e.
This reduces the three-dimensional RGB colour space cube to a two-dimensional triangular space (since the third ordinate is always one minus the sum of the other two). The resulting intensity normalised coordinates are known as chromaticity coordinates. For each image the average chromaticity coordinate for each lesion type present was calculated. In the chromaticity space, a line between any two points passes through all the colours which may be formed by mixing the colours represented by the end points. In this application the lesion colour may vary from pure lesion almost to the background colour so the different lesion types are expected to radiate from the region of the chromaticity space which represents the background colouration.
Figure 2(a) plots the average lesion colours in each image without any normalisation. The ellipses shown are centred on the mean position for each lesion type, with the major axis aligned with the direction of maximum variance (found using the Hotelling transform). The radius of the major axis represents two standard deviations in the direction of that axis. The minor axis length represents two standard deviations in the orthogonal direction. All four lesion chromaticity values are seen to overlap. Figure 2(b) shows the effect of the greyworld normalisation, which partially separates the lesion clusters, in particular differentiating the haemorrhages. Figure 2(c) shows the result of equalisation, which also differentiates the haemorrhages, but appears to increase the overlap in the other lesion types. Finally the result following histogram specification is shown in figure 2(d), which shows the clearest separation of the lesion clusters.
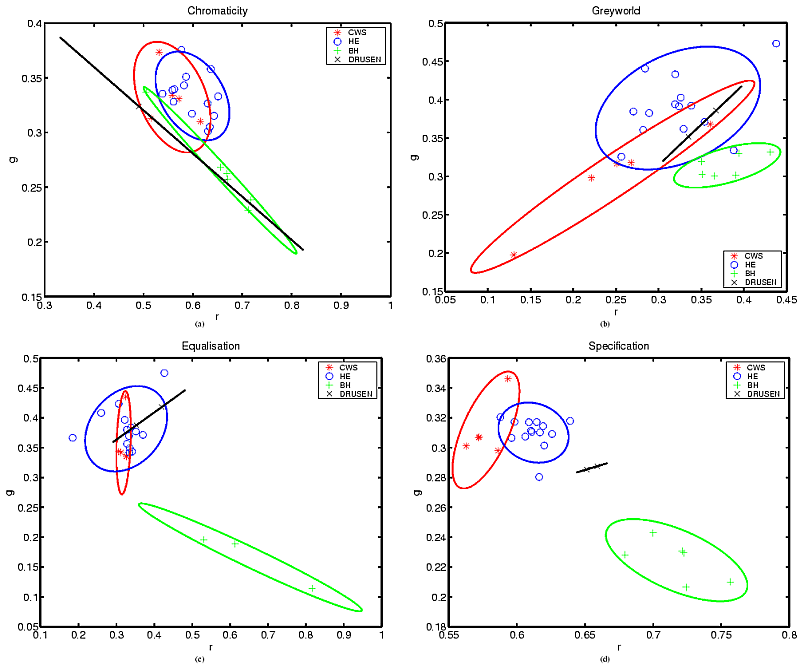
Figure 2: Chromaticity plots: (a) No normalisation, (b) Greyworld normalisation, (c) Histogram equalisation, (d) Histogram specification.
Three normalisation techniques were tested on a set of retinal images. Histogram specification was found to be the most effective normalisation method, improving the clustering of the different lesion types, removing at least some of the variation due to retinal pigmentation differences between individuals. Colour classification is not intended to replace existing intensity-based classification but to augment it and improve overall classification accuracy.
It was not anticipated that histogram specification should perform so much better than equalisation. One possible explanation is the exaggerated contribution of the blue component following equalisation, which possibly loses subtle but important differences in the blue values due to equalisation quantisation.
An important question is whether the differences in retinal background pigmentation are modelled acceptably as a variation in the colour of the illumination. While this is a safe assumption for changes due to lens colouration (since all the incident and remitted light are so filtered), it is less so for background pigmentation changes since not all retinal tissues are equally affected (i.e. the only contribution for non-pigmented tissues such as the optic disc and highly reflective lesions is from scattered and reflected light from pigmented tissue). Clearly the model is inadequate for dealing with local pigmentation variations across an individual retina. However, despite these reservations the results appear to show that an average correction is much better than applying no correction to the images. Variation in colour due to scattering in surrounding tissue and reflections within the orbit can be greatly reduced by imaging using a confocal scanning laser ophthalmoscope (SLO) rather than a fundus camera. Early results using our colour SLO [9] appear to show much less variation in lesion chromaticity, resulting in less overlap between lesions even prior to normalisation.
|
ABSTRACTS/REPORTS: A01128 |
3rd October 2003 | http://www.biomed.abdn.ac.uk/ |