R Gupta† and PE Undrill,
Department of Bio-Medical Physics & BioEngineering,
University of Aberdeen, Foresterhill,
Aberdeen, AB9 2ZD.
ABSTRACT
In mammography, national breast screening programmes have lead to a large increase in the number of mammograms needing to be studied by radiologists. Lesion indicators can be point-like as in micro-calcifications or extended as in stellate lesions or regular masses. Texture analysis has been proposed as a promising method for studying radiographic images in relation to the detection of extended objects. Laws has suggested a suite of filters which may be used to segment or classify an image using textural features and these have been reported as being of value in automatic mammographic glandular tissue classification.
The work reported here suggests the incorporation of additional steps of image processing in an attempt to improve the performance of the Laws filter masks in the detection of lesions. By deriving approximate outlines which are used to identify suspicious regions, the investigation illustrates the properties of one of the filters. After applying the method to a small pre-diagnosed database of stellate lesions and regular masses, the results show that the filter is able to identify the malignant masses in all cases presented. For each non-suspicious case studied, the sum of any false positive areas is statistically insignificant when compared with the extent of true detected regions in the diagnosed instances.
Keywords: Texture Analysis, Mammography Image Processing, Identification of Regular Masses and Stellate Lesions.
Breast cancer is the most common cancer in women (Egan, 1977). Early detection of the cancer leads to significant improvements in conservative treatment. In recent years mammography has proved invaluable in the management of breast cancer and this has resulted in national screening programmes for all women in high risk groups. This, in turn, has lead to a large increase in the number of asymptomatic mammograms being presented, the majority of which are normal. Automated methods of diagnosis therefore need to be established with the aim of improving diagnostic performance by indicating suspicious areas, and a variety of computer based methods have been proposed to improve the radiologist's performance in searching for small, subtle, masked or infrequent abnormalities (Astley 1990, Chan 1990).
In studying mammograms specific features are sought in routine examinations as common indicators of malignancy (Juhl, 1982). These include masses of an approximately regular spherical or stellate shape, micro-calcification clusters and asymmetry between breasts. An early approach to regular mass identification (Lai, 1989) used a median filter followed by template matching of candidate shapes, with the consequence of long processing times. Chan (1987), Davies (1990), Karssemeijer (1992) and Karssemeijer (1993), amongst many others, have focused on micro-calcifications, and Kimme (1975), Giger (1990), and Miller (1993) have addressed asymmetry studies, but less work has been done in identifying regular masses and stellate lesions.
In this work we have attempted to apply established methods of texture determination within a structured sequence of image processing steps and we examine the benefits of this systematic approach to identification by comparing the outlines of regions with characteristic texture as presented by our method with those determined by expert examination.
Central to the analysis of the mammogram is the need to identify specific types of regions of interest. One way to achieve this is to develop features of the image which can be used to classify the image data. The greatest difficulty lies in finding some property of the image from which such features may be extracted.
In discussing this it is helpful to consider the way in which we interpret pictorial scenes. It is generally believed that one of the main visual cues is texture and differences in textural properties between regions. Textural features contain information about the spatial distribution of tonal variations. The concept of tone is based on the intensity of pixels within a defined region (shades of grey in a grey scale image). The texture of a region describes the pattern of spatial variation of grey tones in a neighbourhood where the neighbourhood is small compared to the region. In this study we will be applying the criterion that one component of the manual detection of suspicious areas can be modelled by the identification of areas of reduced texture energy (smoothness) rather than on parameters that are dependent on original image intensity. There are several methods of textural feature extraction described in the literature one of which is Laws Method (Laws, 1980a,b). This produces secondary, strengthened, features which can then be used to segment or classify the image according to the texture energy.
Most reported work on texture is on feature analysis of whole images. For images of non-homogeneous textures, such as mammograms, an additional step of segmentation or classification is required. Laws applied specific filter masks to the data to extract features and then used a statistical classification method to evaluate the significance of the features according to some pre-defined criteria. The Laws method can be used to detect dots, lines and edges. In mammography, it has previously been used to discriminate between glandular and fatty regions of breast tissue (Miller and Astley, 1992), as part of an overall strategy to automatically detect breast asymmetries (Miller and Astley, 1993). They state that processes using intensity thresholding are unreliable due to between-image and within-image intensity variation. In the specific case of the detection of stellate lesions, Kegelmeyer (1992, 1993) uses Laws masks as a mechanism for detecting architectural distortions caused predominantly to the ductal patterns of the mammogram, a stellate lesion perturbing the natural pattern and producing new and characteristic centres of radiation.
Our work addresses the relative simple task of direct application of the masks to achieve lesion outlines, applying histogram equalisation to the original image and the results of texture processing, in an attempt to improve the robustness of the segmentation protocols proposed. We apply the Laws mask to the task of identification of suspicious masses and examine whether this texture based approach indicates prospects of discrimination between stellate lesions and regular masses.
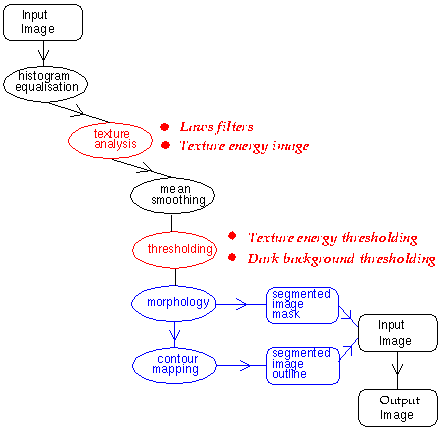
In our implementation there are several stages in the production of the final segmented output, including pre-processing, texture analysis, segmentation and image enhancement. These have been added to provide a framework for the automatic execution of the texture analysis process which is then evaluated using a pre-diagnosed image data base. These image processing steps are linked as shown in Figure 1 and will be explained in sequence. The functions were constructed and executed within the visual programming environment available in the KHOROS image processing software (Rasure, 1990).
The images we used were taken from a pre-diagnosed database of mammograms distributed by the University of South Florida. It holds digitised images of 100 mammograms, 50 non-suspicious (meaning that they show no malignant features) and 50 abnormal. The abnormal mammograms are categorised according to the type of malignancy presented and include regular masses and stellate lesions. The diagnoses were provided by a local radiologist and each was confirmed by biopsy. The lesion boundaries were indicated by separate truth-maps. The images are of various sizes (approximately 600 x 800 pixels) and each is 8-bit deep, approximately normalised in intensity, giving a 0-255 grey scale. The average resolution is 0.22mm/pixel.
The images used in the analysis comprised 8 regular masses, 8 stellate lesions and 15 images of non suspicious mammograms chosen at random from the 50 images so reported. The stellate lesion and regular mass images were chosen for this investigation as these are particularly strong indicators of tumours in mammography and the automatic delineation of tumour extent (and its variation with time and treatment) is seen as major quantitative issue by radiologists. Initially 256 x 256 pixel regions (small extracts) of the abnormal mammograms were used which were manually chosen to include the malignant mass. The method was then applied to the full extent of the breast and surrounding tissue image (large extracts) for all 31 of the mammograms, to establish the extent of false positive detection.
Fig. 1 Image processing stages.
Gordon (1984) and Dhawan (1986) have applied regional contrast enhancement techniques to mammograms, purely as a visualisation aid. The adaptive histogram algorithm has been further developed and evaluated by Zimmerman (1988) but does introduce within-image spatial variations which can be confusing to observers and to subsequent analysis algorithms. Many of these regional techniques can be computationally intensive although modern parallel processing hardware can substantially reduce this problem (Pizer 1990, Undrill 1993). For this work we chose to link together simple global histogram techniques, followed by image normalisation, with texture and morphological processes.
When performed on original image extracts, histogram equalisation was found to be useful in visualising the lesion and increasing the sensitivity of subsequent processing. The effect can be seen on the small extract from the regular mass image, mam74, in Figure 2. On the original, histogram equalisation highlights the lesion and other dense adipose tissue from the rest of the parenchymal background. On the textured image it enables the smooth area of the lesion to be clearly distinguished.
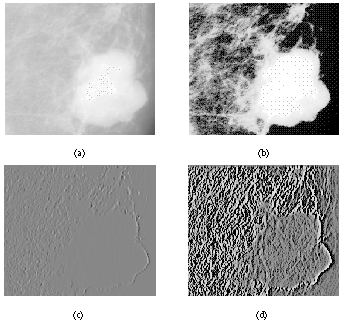
Fig. 2 Effects of Histogram Equalisation :
(a) Original Image; (b) Image after histogram equalisation; (c) Texture Image before histogram equalisation; (d) Texture image after histogram equalisation
Although co-occurrence matrices are a well established measure of texture (Haralick, 1973), Laws has developed and described a method of texture analysis (Laws, 1980a,
1980b), particularly applicable to radiographic images, which seeks to classify each pixel of an image. The Laws method uses filter masks to extract secondary features from natural micro-structure characteristics of the image (level, edge, spot and ripple) which can then be used for segmentation or classification.
Laws developed five labelled vectors which could be combined to form matrices. When convolved with a textured image these matrices extract individual structural components of the image. The five vectors are :
[ 1, 4, 6, 4, 1] = L5    [-1,-2, 0, 2, 1] = E5     [-1, 0, 2, 0,-1] = S5
             [ 1,-4, 6,-4, 1] = R5     [-1, 2, 0,-2, 1] = W5
After a preliminary study, the R5R5 (RR) mask was found to give the best performance for mammograms, confirming earlier results of Miller and Astley (1992) in their different diagnostic situation. Using a sample image from each of the abnormalities under investigation, alternative L5S5 (LS) and S5R5 (SR) masks were evaluated (Gupta, 1993). Although the differences were not great, the RR mask produced a lesion outline of 70% of the true outline for both abnormalities, whilst the other masks dropped to 45% in the case of the stellate lesions and 56% for the regular masses. The RR mask is shown below :
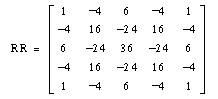
This is an iso-directional, differentiating filter. Note that each row and column has an individual mean of zero. The mask extracts non-vertical and non-horizontal edges producing the Laws texture image. Edge strengths are enhanced dependent on underlying texture. This has the effect of giving a relatively uniform response in smooth areas such as breast masses compared with the more highly textured regions such as the adipose tissue, as seen in Figures 2(c) and 2(d). So that these regions can be thresholded, a derived image is generated by calculating the variance over a small window centred about each point in the original Laws texture image. In accord with other workers we will call this a measure of texture energy. The size of the window was found not to be critical, similar effects being observed between 5 x 5 and 9 x 9 pixels.
The texture energy images were then smoothed, to reinforce the difference between the various types of micro structure detected by the masks by reducing the effects of noise and local variability within dissimilar regions. A moving window average was taken over the whole image using a unit weighted kernel of size of 9 x 9 pixels. The use of a median filter was considered and might have better retained the edge strengths implicit in the energy image, but its application at 9 x 9 over the full size image was very much slower.
Segmentation is the decomposition of an image into smaller, meaningful constituent parts, or 'segmented objects'. Thresholding is the simplest method of segmentation which uses intensity values to split the image domain into segmented objects and background areas.
Two thresholding stages were needed. This is because the texture masks extracted not only the relatively smooth regions of the masses but also the smooth film background. The first thresholding, applied to the texture energy image, segmented it into smooth and highly textured regions. This was achieved by applying a window defined by upper and lower thresholds and retaining only those pixels falling within that window. The values for these were taken from a histogram of the smoothed texture energy image which contained a clear upper peak representing the highly textured regions and a lower peak representing the smoothly textured region, as shown in Figure 3. The threshold limits chosen encompassed this lower valued peak, from a near zero value to the mid-peak minimum.
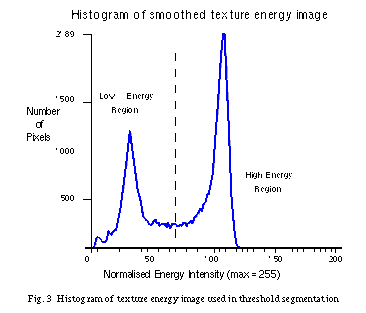
Fig. 3 Histogram of texture energy image used in threshold segmentation
For this work it was decided to estimate these directly from the graph. Using a few test images to derive the representative parameters, these were fixed and applied to all images. This approach has the advantage that it could be used to confirm that the mammogram images satisfy the test conditions and, if required, be implemented as a short automatic procedure prior to any future routine analysis.
A segmentation refinement was then applied using a logical mask derived from the coincidence of areas of near-zero intensity values of the equalised original image and low texture energy threshold to eliminate the uniform dark film background. This threshold level could be set at a fixed value across all the images. The final result of the segmentation process was thus a binary image of lesion segmentation objects against a non-lesion background.
The two morphological functions, opening and closing , (Haralick, 1987) were used to reduce the spatial noise introduced by the binary thresholding, employing a 5 pixel diameter circular structuring element. The technique smoothed the lesion contour, filled small holes and eliminated small distinct areas leading to a more accurate representation of the lesion.
The final stage in producing an image outline was to develop a contour map of the segmented region. This was achieved using the Sobel filter as an edge detector. Edge detection was found to work better on the binary images (using a binary version of the output of the thresholding stage) than on the original images, where lesion edges are indistinct due to the inherent irregularity of breast tissue density (compounded by the depth effect in radiography of projecting a 3D object onto a 2D image plane) and where there are noise effects intrinsic to the radiographic imaging and data capture processes. In Figure 4(a) the smoothed texture related energy image (higher intensities show more homogeneous areas) is thresholded to give a binary image, (b), which after morphological processing and edge marking results in an outline image as in (c).
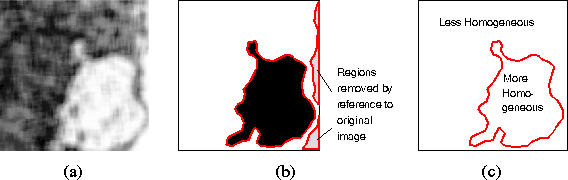
Fig. 4 Establishing a region boundary
This is a freely available image processing package produced by the University of New Mexico. It consists of a library of 'C' functions which are accessed via the CANTATA visual programming environment using a graphical user interface. With these functions the user is able to generate or import images, perform various processing operations upon them and display the results or save them to files. The software provides a flexible prototyping approach to developing image processing routines, selecting modules as required and 'plugging' them together as process building blocks to form a screen-based pictorial flowchart. Pre-defined software modules can however introduce difficulties of inflexibility, and one such problem, encountered in segmentation, was that the KHOROS thresholding function imposed a lower limit of 1, causing small 'holes' in some images.
The qualitative results are the images produced using the test method. These provide an initial, intuitive, assessment of the technique.
Figure 5 shows a sample of images where the truth outline (green) and outline produced by our method (red) are superimposed upon the original image. The truth outline was obtained directly from the mammogram database while the test outline was produced by finding the edges of the segmented objects.
Figure 5 shows two examples of detail from regions of the 256 x 256 extracts where (a) is a stellate lesions and (b) is a regular masses. In both cases the test outline (red) roughly follows the radiologist's delineation (green). Also in these two images the radiologist's line includes regions of significantly different texture to the main body of the mass. As expected, these areas have not been extracted by the test method.
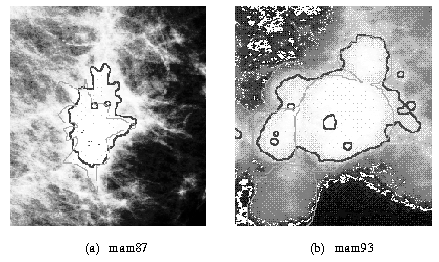
Fig. 5 Diagnosed (green) and processed (red) detail from small region extracts.
In Figure 6 the method has been repeated on the whole mamma. The method has found the true lesion as in the smaller extracts. However, in addition, other dense tissue, for example the pectoralis major muscle, has also been detected.
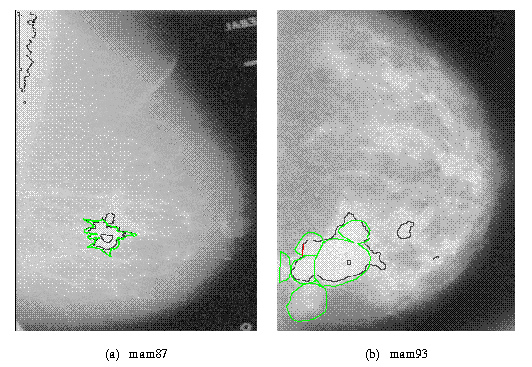
Fig. 6 Diagnosed (green) and processed (red) outlines for complete large region extracts
Quantitative Results
Quantitative results for the abnormal mammograms have been illustrated by two sets of statistics which compare the results given by the test method with those of the radiologist. The first is area based and represents the absolute difference between the detected areas in the test lesion, as determined by the texture mask and allied processing, and the true lesion as determined from the radiologist's marked boundary. The second is taken from the mean intensities and standard deviations of the test and true lesions. When applied to the non-suspicious mammograms the first of these statistics seeks to measure how much false area is extracted by the method on the whole mamma images, showing the number of false positive pixels as a percentage of the total number of pixels.
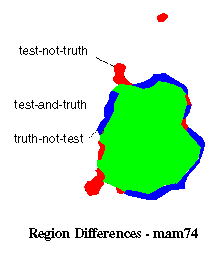
The rationale behind this representation was to find a way of numerically comparing the shape and extent of the area (in pixels) of the test and true lesions. It was decided to measure the truth-and-test area, called the true positive region (denoted TPR) and the test-not-truth area, called the false positive region (denoted FPR). To make these independent of lesion size and to relate them to the true mass size these areas were calculated as a percentage of the true lesion area (in some cases the number of false postive pixels exceeded the number of pixels in the true lesion giving an FPR exceeding 100%). While this data does give some indication of the accuracy of the test lesion it does not distinguish between those test-not-truth areas connected to the mass and those distinct from it.
Summary

 TPR =  true positive region
     = overlap of truth and test regions

 FPR = false positive region
     = test region outside of truth region

   W = whole true lesion area

 TPR% = TPR x 100/W
 FPR% = FPR x 100/W
Fig. 7 Definition of the TPR and FPR Statistic.
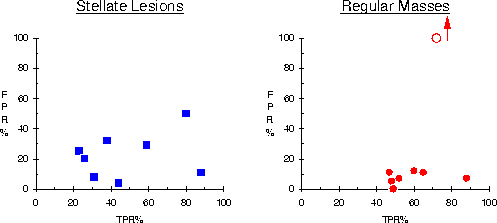
This data is depicted on scatter graphs plotting FPR % against TPR % for each lesion (see Figures 8 and 9). The ideal situation would be represented by a clustering of points close to 0% FPR and 100% TPR. [It will be noticed that in Figures 8(b), 9(a) & 9(b) there are a few points extended by an arrow. These points represent unusually large FPR % values, and will be discussed later.]
                (a)                                 (b)
  Fig. 8 Test lesion regions as percentages of true lesion area for
                        small region extracts.
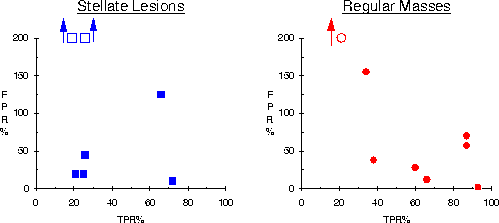
                (a)                                 (b)
  Fig. 9  Test lesion regions as percentages of true lesion area for
                        large region extracts.
Referring to Figure 8 it is seen that for the small extract graphs the FPR % values range (with one exception) from 0-50%. This means that, in general, the areas of normal tissue incorrectly labelled as outside the denoted boundary were less than half the area of the true lesion. The exception to this generalisation is the mammogram which caused the very high value of FPR % shown by the arrow. High FPR % values can arise from areas of lighter tissue around the mass being detected, as is beginning to happen in Figure 5(a). Another, less common, reason is that in addition to the correct mass the test method has also highlighted a relatively large area of tissue positionally distinct from the reported true lesion and not included in the truth map. This region has therefore to be taken as a false positive detection. In Figure 5(b) in addition to a common outlined area, the truth image suggests two satellite regions, at a much lower intensity which the method has failed to identify (apart from a very small island on the image boundary which might be an artefact).
The overall specificity for the large extracts was less successful (see Figure 9). Here the FPR % values have been raised by the detection of pectoral muscle area with similar texture characteristics (Figure 6(a)), and the TPR % values have been further depressed by a relative underestimate using large extracts, when compared with the 256 x 256 pixel small extracts. If we exclude those points where the method has detected areas outside the normal breast area the FPR / TPR statistic can be summarised as in Table 1, indicating a more consistent performance when small image extracts containing the lesion are examined, compared with the large image extracts.
                                   Stellate Lesions    Regular Masses
                                    FPR %     TPR %    FPR %    TPR %
Small Extracts     Lower Bound        8        23        0        47
                   Upper Bound       50        88        12       89
Large Extracts     Lower Bound       10        21        2        34
                   Upper Bound       150       72       155       93
Table 1 Variation of FPR% and TPR% with lesion type and image extract size
The TPR figures are better for regular masses than stellate lesions reflecting the fact that the radiologist's outline for stellates includes background parenchyma containing the stellate rays whereas the automated method focuses towards the centre of the lesion. Nevertheless in all cases the lesion areas have been identified.
This statistic attempted to give a measure of the quality of the area extracted by the test method rather than its size. Here, quality was defined in terms of the type of tissue extracted by the test method. The intention was to find a simple statistic characteristic of this tissue region and thus assess whether or not it was similar to that of the true lesion. The normalised mean intensity of the pixels within the true lesion area and the test lesion area were compared for large extracts (whole mamma) of the original images. These values depend upon the type of tissue found within the mask boundary and therefore should be less dependent on the size of the area. If much non-tumorous dense tissue has been extracted, the test mean intensity is significantly higher than the true mean intensity. If on the other hand dark adipose tissue has been incorrectly extracted the test mean is lower than the true mean. The test mean intensities were plotted against the truth mean intensities for each image, for each mask. These are shown in Figure 11.
The ideal situation is shown by a straight line passing through
the origin (truth value equals test value). The degree of scatter
about the line indicates the deviation of the test mean from the
true mean. Both the stellate lesion graph and the regular mass
graph show that the test lesions were in general lighter (higher
intensity values) than the true lesion. This reflects the fact
that usually the test region is more closely confined to the centre
of the mass than the radiologist's outline, although the effect
is more strongly evident in the case of the stellate lesions (Figure
11(a)). It is clear that the intensity ranges do not suggest a
means of differentiating between lesion types, confirming one
of the presumptions in our earlier stated observer model.
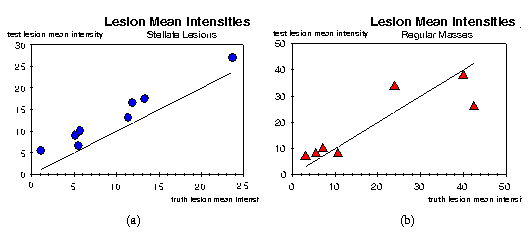
Fig. 11 Truth area mean intensity versus test lesion area mean intensity for large region extracts.
The standard deviations of regional intensity for the large extracts are shown in Figure 12. As we have seen, this parameter can be considered a measure of roughness or texture energy. It can be seen that the test method gives a more consistent result for both stellate lesions and regular masses, that is they exhibit lower standard deviations
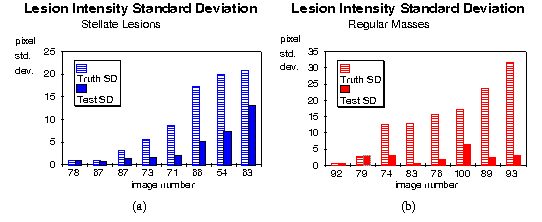
Fig. 12 Standard deviation of intensity for large region extracts
For the regular masses and the stellate lesions, the pixel intensity standard deviations using our method are less (more uniform intensity region delineated) than those of the diagnosed area by average factors of 4.9 and 2.2 respectively, with each containing two instances where the diagnosed and test region have equal standard deviations. However, if we examine the distribution between lesion types using Student's t-test, comparing the test results and truth results separately, 't' values of 0.83 and 1.06 are returned, giving a probability of being representative of different populations of only 57% and 69%. If we propose the hypothesis that following our processing and outlining method the stellates have a higher standard deviation of texture energy than the regular lesions ( data in Fig 12 (a) greater than Fig 12 (b)) then these values increase to 78% and 85%, but none of these results suggest differences at statistically significant levels, reinforcing our view that the processing protocols are more successful at identification than differentiation.
Finally the technique was evaluated on the mammograms randomly selected from the non-suspicious section of the data base. The method outlined small regions in 5 out of the 15 non suspicious mammograms. The areas identified were generally very small compared to those in abnormal mammograms, as shown in Figure 13.
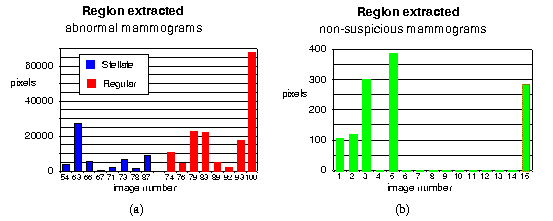
Fig. 13 Lesion Areas detected for Abnormal and Non-Suspicious cases (large image extracts). [Figures (a) and (b) are presented at different ordinate scales]
Fig 13(a) shows the extracted areas for the abnormal lesions. (Image sequence 54 - 87 are stellate lesions and 74 to 100 are regular masses). We first establish whether these represent two different populations, by applying a Mann-Whitney (Wilcoxon rank sum) non-parametric test, since it is unrealistic to presume any specific underlying distribution. Median values are 450 and 1450 pixels respectively which produce a confidence level of 85% that the two data sequences emanate from distinct populations. Since this is not significant at normally acceptable levels we can compare the abnormals as a single distribution against the non-suspicious set, Fig 13(b). Using the same test, median values of 5500 and 10 pixels for the two distributions are established, giving a confidence level of greater than 97.5% that the two distributions are different, suggesting that our protocols are an effective method of area detection.
Acknowledgements
The authors wish to acknowledge the efforts of Kevin Bowyer of the University of Southern Florida Medical School for the pre-diagnosed digital mammogram data base, the UK Science and Engineering Research Council (SERC) for financial support to Miss Gupta on the MSc in Information Technology (Medical Physics) at Aberdeen University, during which part of this project was carried out and to Mr. George Cameron and Dr. Philip Ross for their invaluable technical assistance with computers and software.
References
ASTLEY S M and TAYLOR C J 1990 Combining cues for mammographic abnormalities Proc. 1st British Machine Vision ConferenceOxford UK 253-258
CHAN H P, DOI K et al. 1987 Image feature analysis and computer-aided diagnosis in digital radiography. Automated detection of microcalcifications in mammography Medical Physics 14 (4) 538-548
CHAN H P, DOI K, VYBORNY C J, LAM K J and SCHMIDT R A 1990 Improvements in radiologists' detection of clustered microcalcifications on mammograms: the potential of computer aided diagnosis Invest. Radiol. 25 1102-1110
DAVIES D H and DANCE D R 1990 Automatic computer detection of clustered calcifications in digital mammograms Phys. Med. Biol. 35 1111-1118
DHAWAN A P, BUELLONI G and GORDON R 1986 Enhancement of mammographic features by optimal adaptive neighbourhood image processing IEEE Trans. Med. Imag. MI-5 8-15
EGAN R L Technologists guide to mammography 2nd edition Williams and Wilkins Company 1977
ERIKSEN J P, PIZER S M and AUSTIN J D 1990 MAHEM: a multiprocessor engine for fast contrast limited adaptive histogram equalisation SPIE Conference Medical Imaging IV - Image Processing SPIE Vol. 1233
GIGER M L, YIN F, DOI K, METZ C E, SCHMIDT R A and VYBORNY C J 1990 Investigation of methods for the computerised detection and analysis of mammographic masses SPIE Conference Medical Imaging IV - Image Processing SPIE Vol. 1233 183-184
GORDON R and RANGAYAN R M 1984 Feature enhancement of film mammograms using fixed and adaptive neighbourhoods Applied Optics 23 560-564
GUPTA R 1993 Texture analysis of mammograms utilising the Laws matrices MSc Project Report Department of BioMedical Physics and BioEngineering University of Aberdeen
HARALICK R M, SHANMUGAN K and DINSTEIN I 1973 Textural features for image classification IEEE Trans. Sys. Man. Cyb. SMC-3 6 610-620
HARALICK R M, STERNBERG S R and ZHUANG X H 1987 Image analysis using mathematical morphology IEEE Trans. Patt. Anal. Mach. Intell. PAMI-9 4 532 - 550
JUHL J Paul & Juhl's essentials of roentgen interpretation 4th edition Harper & Row 1982 pp340-345
KARSSEMEIJER N 1992 A stochastic model for automated detection of calcifications in digital mammograms Image and Vision Computing 10 369-375
KARSSEMEIJER N 1993 Recognition of clustered microcalcifications using a random field model SPIE Conference Biomedical Image Processing and Biomedical Visualisation SPIE Vol. 1905 776-786
KEGELMEYER W P Jr 1992 Computer detection of stellate lesions in mammograms SPIE Conference Biomedical Image Processing and Three-dimensional Microscopy SPIE Vol. 1660 446-454
KEGELMEYER W P Jr 1993 Evaluation of stellate lesion detection in a standard mammogram data set SPIE Conference Biomedical Image Processing and Biomedical Visualisation SPIE Vol. 1905 787-798
KIMME C, O'LOUGHLIN B J and SKLANSKY J Automatic Detection of suspicious abnormalities in breast radiographs Data Structures Computer Graphics and Pattern Recognition Academic Press New York 1975
LAWS K I 1980a Textured image segmentation PhD Thesis,Report 940 Image Processing Institute University Southern California Los Angeles
LAWS K I 1980b Rapid texture identification: Image processing for missile guidance SPIE Vol. 238 pp 376-380
LAI S LI X and BISCHOF W F 1989 On techniques for detecting circumscribed masses in mammograms IEEE Trans. Med. Imag.MI-8 377-386
MILLER P and ASTLEY S 1992 Classification of breast tissue by texture analysis Image and Vision Computing 10277-283
MILLER P and ASTLEY S 1993 Automated detection of breast asymmetries Internal Report Dept of Medical Biophysics University of Manchester
RASURE J R, ARGIRO D, SAUER T and WILLIAMS C 1990 A visual language and software development environment for image processing Intl. J. Imag. Sys. & Technol. 2 183 - 199
UNDRILL P E and CAMERON G G 1993 Application of SIMD parallel systems to low level image processing MIRIAD (Medical Image Reconstruction Interpretation Analysis and Display) Project Report British Technology Group London UK 43-51
ZIMMERMAN J B, PIZER S M, STAAB J R et al. 1988 An Evaluation of the effectiveness of adaptive histogram equalisation for contrast enhancement IEEE Trans. Med. Imag. MI-7 304-312